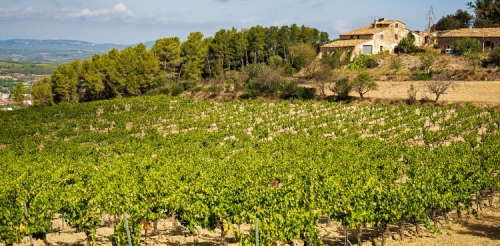
20201217_DTA_PRM_PatxiUriz_Oliveras_Collbato_DSC6146
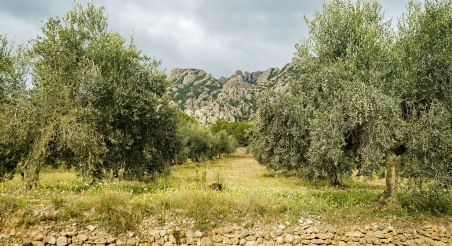
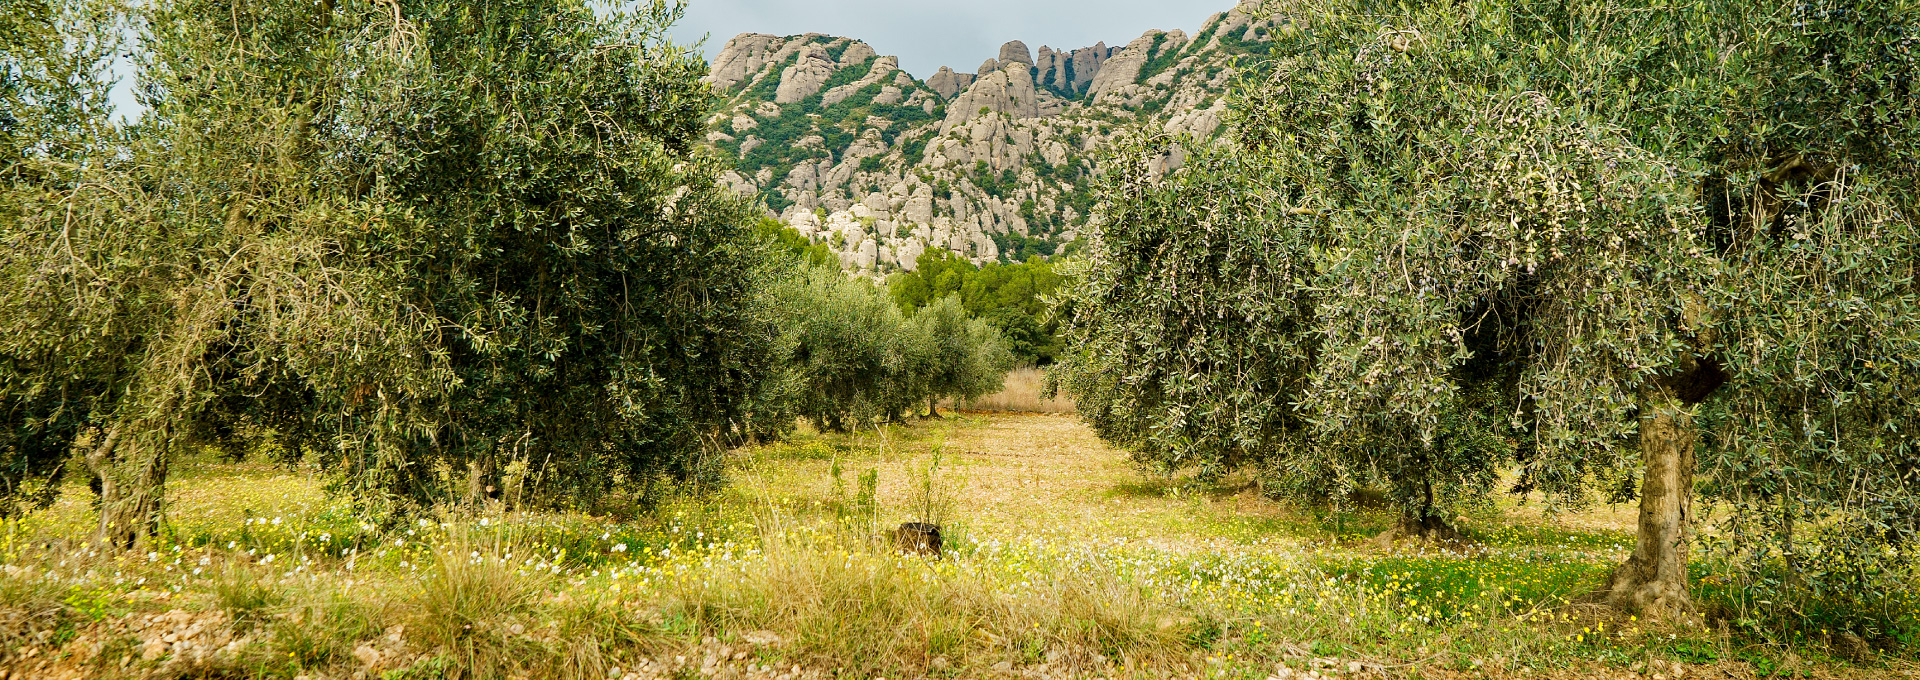
Olive grove in Montserrat Rural Park. PATXI URIZ | BARCELONA PROVINCIAL COUNCIL

Land Use

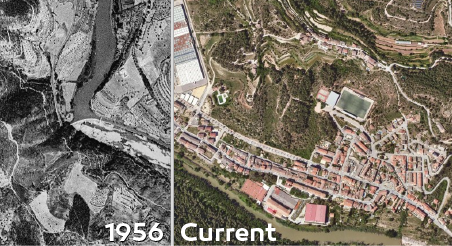
Do you know how land use has changed in Barcelona's province since the 1950s? Find out in this detailed analysis.


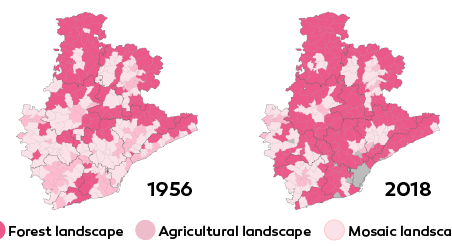
Source: Land cover maps from 1956 and 2018

To find out how the general distribution of the territory has changed in the last sixty years, we have compared the latest land cover map from 2018, published by the Cartographic and Geological Institute of Catalonia (ICGC), with a map from the 1956 orthophoto of the province.

Methodological note

Data sources:

  • Land cover map (2018): Published by the ICGC, it is the latest map available, as the previous one was from 2009. 
  • Land cover map (1956): Generated from the 1956 orthophoto of the province of Barcelona."This flight is better known as "the American flight" and represents an point of reference to understand what the territory was like before the economic and social development of the 60s and 70s of the last century. The Barcelona Provincial Council generated the orthophoto of 1956 for all the province of Barcelona from the original frames provided by the Ministry of Defence. In this project, the corporation counted on the collaboration of the Center for Ecological Research and Forestry Applications (CREAF) to generate the cover map.

Using the information from these two sources and the current municipal boundaries, we categorized the province's surface into three land uses: agricultural, forestry, and urbanized areas. Although the original maps had more detailed categories for agricultural and forested areas, we simplified them into these three general uses to illustrate the major changes over six decades.

The information can be accessed by municipality, groups of municipalities, county, and the entire province.

Creation date
Update date
More information about
Share
You may be interested